
Page 3 - Mt Pleasant Annual Report
P. 3
DOWN THE DRAIN!
Where does it go?
Mount Pleasant Waterworks’ (MPW) wastewater system includes two major components: the collection system and
the treatment plant. Our state-certified licensed operators and sta do an excellent job managing both. Wastewater
collection and treatment is a 24-hour-a-day, 7-day-a-week responsibility. Ultimately, our goal is to protect both the
environment and the quality of life in Mount Pleasant.
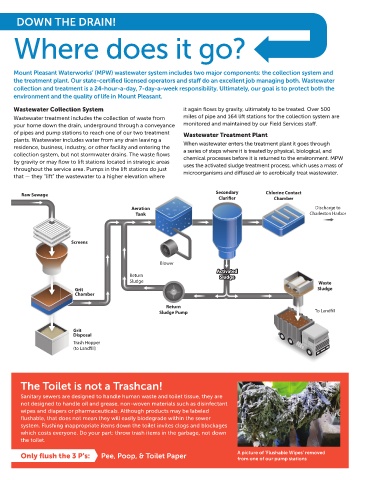
Wastewater Collection System it again flows by gravity, ultimately to be treated. Over 500
Wastewater treatment includes the collection of waste from miles of pipe and 164 lift stations for the collection system are Capital Improvements collects and analyzes over 14,000 samples annually to comply
your home down the drain, underground through a conveyance monitored and maintained by our Field Services sta . Mount Pleasant has seen unprecedented growth over the years with state and federal regulations. We are required to monitor
of pipes and pump stations to reach one of our two treatment Wastewater Treatment Plant and improvements are a continual part of our operations. We are certain parameters daily and report monthly through our
plants. Wastewater includes water from any drain leaving a When wastewater enters the treatment plant it goes through currently undergoing a $75 million dollar upgrade at our Rifle Discharge Monitoring Reports to South Carolina Department of
residence, business, industry, or other facility and entering the a series of steps where it is treated by physical, biological, and Range Road Treatment Plant which will allow us to increase our Health and Environmental Control (SCDHEC). MPW continues
collection system, but not stormwater drains. The waste flows chemical processes before it is returned to the environment. MPW treatment capacity and accommodate growth. to meet and exceed those requirements and we are recognized
by gravity or may flow to lift stations located in strategic areas uses the activated sludge treatment process, which uses a mass of each year for our outstanding track record through the SCDHEC
throughout the service area. Pumps in the lift stations do just microorganisms and di used air to aerobically treat wastewater. Environmental Protection Facility Excellence Award. This is a rigorous award process
that — they “lift” the wastewater to a higher elevation where which demonstrates our hard work and commitment to
MPW operates under an NPDES (National Pollution Discharge excellence. Protecting the environment is our top priority.
Elimination Systems) permit which outlines treatment
Raw Sewage Secondary Chlorine Contact requirements compatible with ambient environmental Below is the 2019 annual summary of MPW’s treated wastewater
Clari er Chamber e uent water quality.
conditions. Our state-certified environmental laboratory
Aeration Discharge to
Tank Charleston Harbor
2019 Wastewater Report Data: Permit # SC0040771
Measure 2019 Actual Regulatory Requirement/Limit
Screens WASTEWATER COLLECTION SYSTEM ANNUAL AVERAGES
Report to SCDHEC
Reportable Sanitary Sewer Overflows (SSOs) 0 total
>5,000 gallons: Limit 2 per 100 miles of pipe
Blower Pipeline Corrective Maintenance 0.45 per 100 miles of pipe No Regulatory Requirement
Activated
A c tiv a t ed
Return Sludge Pipeline Inspection via 20 miles No Regulatory Requirement
Sludge
Robotic Video Camera
Sludge Waste
Grit Sludge Pipeline Cleaned 82 miles No Regulatory Requirement
Chamber
WASTEWATER COLLECTION SYSTEM ANNUAL AVERAGES
Return Flow 5 MGD 6 Million Gallons per Day (MGD) Design Capacity
Sludge Pump To Land ll
Biochemical Oxygen Demand (CBOD) 5 mg/L 25 mg/L Monthly Average
Enterococci 5 MPN/100mL 35 (MPN/100mL) Monthly Geometric Average
Grit
Disposal Ammonia 0.2 mg/L (Mar-Oct) 20 mg/L, (Nov-Feb) Monitor and Report
Trash Hopper
(to Land ll) Total Suspended Solids 5 mg/L 30 mg/L Monthly Average
CBOD % Removal 98% 85% Minimum
TSS % Removal 97% 85% Minimum
CENTER STREET WASTEWATER TREATMENT PLANT ANNUAL AVERAGES
The Toilet is not a Trashcan! Flow 3 MGD 3.7 Million Gallons per Day (MGD) Design Capacity
Sanitary sewers are designed to handle human waste and toilet tissue, they are Biochemical Oxygen Demand (CBOD) 5 mg/L 25 mg/L Monthly Average
not designed to handle oil and grease, non-woven materials such as disinfectant Enterococci 16 MPN/100mL 35 (MPN/100mL) Monthly Geometeric Average
wipes and diapers or pharmaceuticals. Although products may be labeled Ammonia 0.2 mg/L Monitor and Report
flushable, that does not mean they will easily biodegrade within the sewer
system. Flushing inappropriate items down the toilet invites clogs and blockages Total Suspended Solids 8 mg/L 30 mg/L Monthly Average
which costs everyone. Do your part: throw trash items in the garbage, not down CBOD % Removal 97% Monitor and Report
the toilet.
TSS % Removal 96% Monitor and Report
Only flush the 3 P’s: Pee, Poop, & Toilet Paper A picture of ‘Flushable Wipes’ removed COMBINED RIFLE RANGE ROAD AND CENTER STREET WASTEWATER TREATMENT PLANTS
from one of our pump stations
Ultimate Oxygen Demand (UOD) 1,128 lbs/day 11,415 (Mar-Oct) 15,111 (Nov-Feb) Pounds per Day